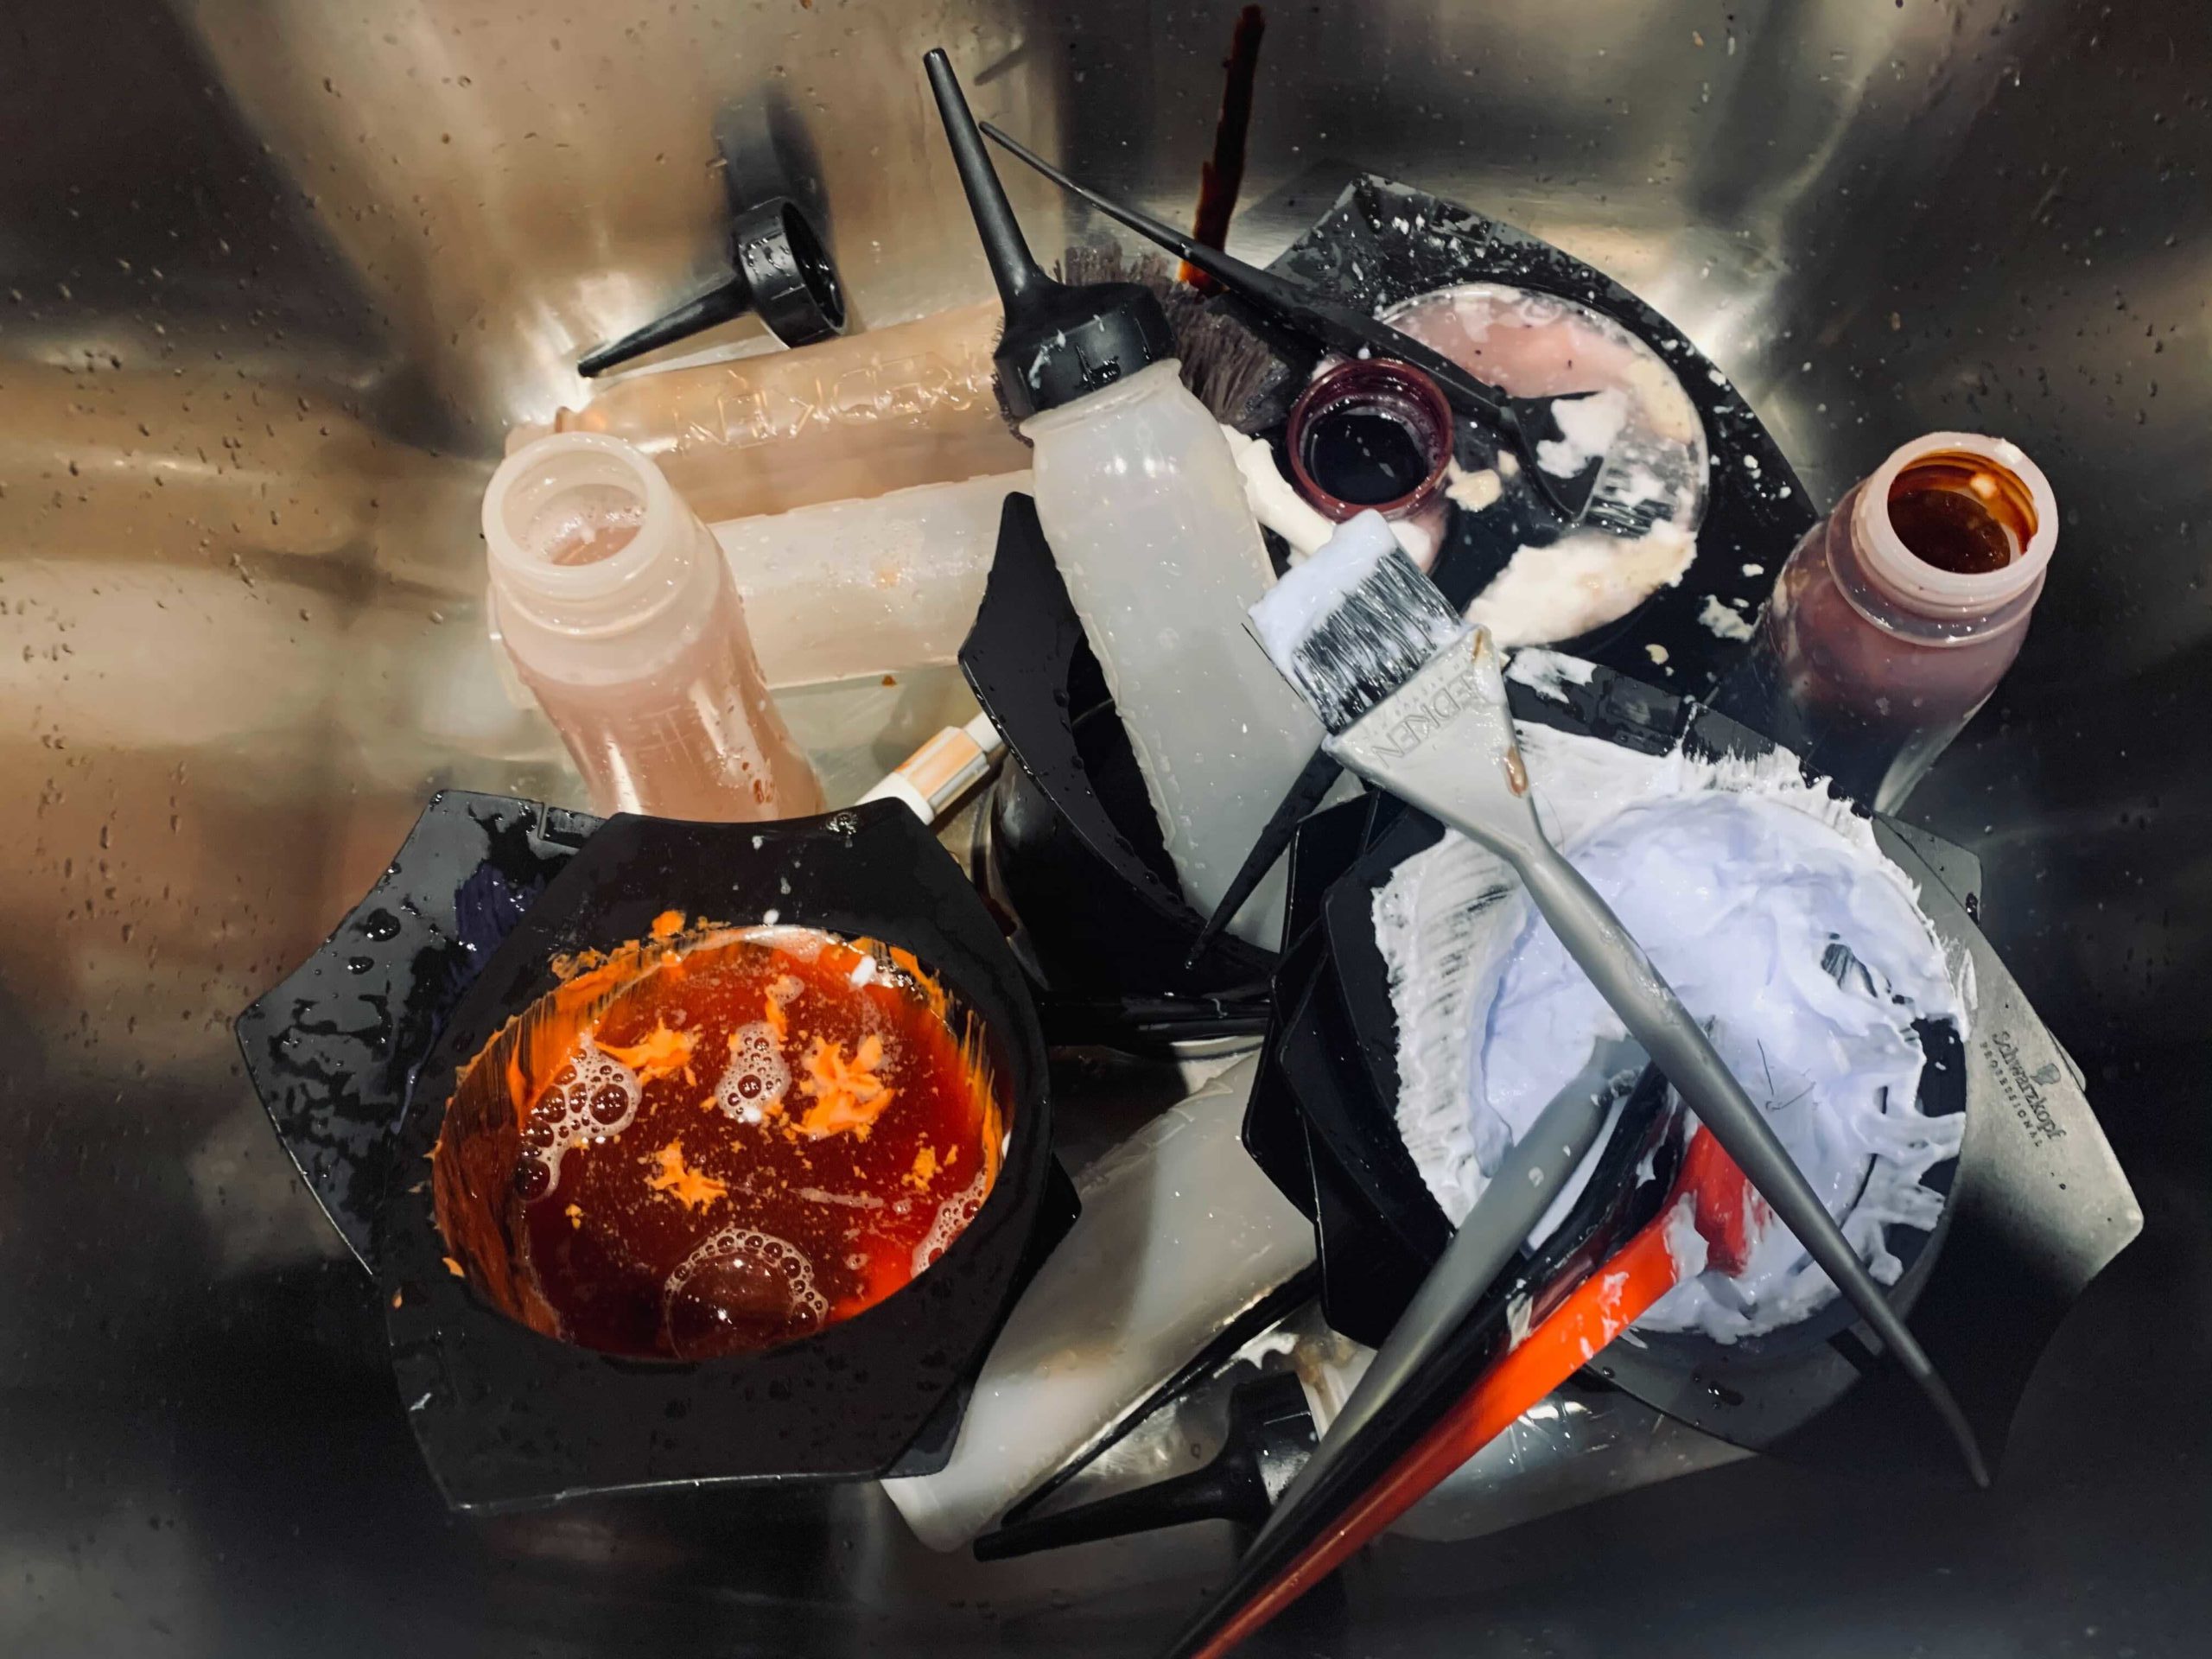
Every year, 15 million pounds of color is wasted in the United States, which equates to about 27% of color purchased in the industry. That means that over a quarter of every tube of color never touches a client’s head. Waste underpins the performance of the color department in salons and there are some key metrics that will help you understand how well your color business is performing.
Where it All Begins: Profit Margins
The salon industry runs on averages; Salons base the quantity of color mixed off of what is seen in the industry, rather than what is right for their services and clients. The industry average for a retouch is 40 grams of color, but what happens when more is used and not tracked? The salon runs out of inventory more quickly than anticipated and loses money when more color is used for the length and density of the client’s hair. And what about the other end of the spectrum – using less than the anticipated 40 grams? The 40 grams has already been mixed, leaving all of the extra product to be poured down the drain. Both of these scenarios aren’t great for business, affecting your bottom line and impacting the environment.
Basing the product use and profit margins on industry averages rather than personalizing it for the service leaves your profit margins in a vulnerable position. Vish has tracked that profit margins can vary by up to 20% across different service categories. Knowing exactly what each stylist in your salon uses on every service will give you the ability to accurately predict future profits, ensure your inventory is precisely stocked, and is the best way to guarantee your profit margin.
Variance in Cost Per Service
The average cost per service ranges from $3 – $18 depending on the service being performed, the color line, and the stylist. With this much variance, it means some services may be profitable but others are low or unprofitable. Why not standardize the profit margin and guarantee the same profit on every service? This table shows the average cost per service for the three most common services performed in salons and their gross profit margin.
While a highlighting service, which uses low-cost products like lightener, has a cost per service of only $3.74 (gross profit margin of 45%) toners have a higher cost of $6.02 and an average charge of $27 per service, leaving the gross profit margin at only 28%.
Flipping the process and starting with the profit margin you want to make, adjusting your price and policies will guarantee your salon is making money on each and every service. standardizing the gross profit margin to 50% across all services can have a big impact on your overall profitability. Using the same example, but adapting the service pricing to guarantee a standard profit margin, this 8-chair salon sees a dramatic uplift in much-needed profits.
Strategic Pricing to Safeguard Your Profit Margins
Aside from all-inclusive pricing, there are two main ways to change your pricing structure: separating product and labor charges, or setting product allowances and charging for any additional product used. Separating product and labor requires a complete change in pricing culture and a revamp of your price list. It also means that nearly every service will be charged differently, but owners that price this way can charge precisely for the product used without paying a commission on the inventory they provided to stylists
Setting a product allowance requires the salon owner or manager to set a threshold of product to use in a service, and charge for any additional product used. This method sets boundaries that safeguard your margins but retains the familiar service menu pricing for clients and stylists.
All this to say, you don’t want to be overmixing color just because you’ve found a way to charge your clients instead of absorbing the cost yourself. Formula tracking helps you ensure the precise ratios and consistency are tracked per client and available the next time a client comes in. Having a personalized track record eliminates color waste and is more efficient for the business, the stylist, and the client.
Controlling Costs by Eliminating Waste
Anywhere from 25% – 40% of color purchased is wasted, meaning that salons are spending money just to pour it down the drain. One of the best ways to reduce that spend is by eliminating color waste, reducing costs per service across your salon, and ultimately reducing your inventory spend. So not only are you becoming an environmentally sustainable salon, you are becoming more economically sustainable as well.
Ensuring clients don’t pay for wasted product
Every pound of color that is wasted (and there are 15 million pounds wasted each year) takes away from profits salons could be banking. Not only are you eliminating waste, but you’re also only charging clients for exactly what is used on their head, not what is being left in the bowl.
Save your profits, charge clients fairly, and eliminate color waste in your salon.
#GetVish
